The best CECL analytics are built with
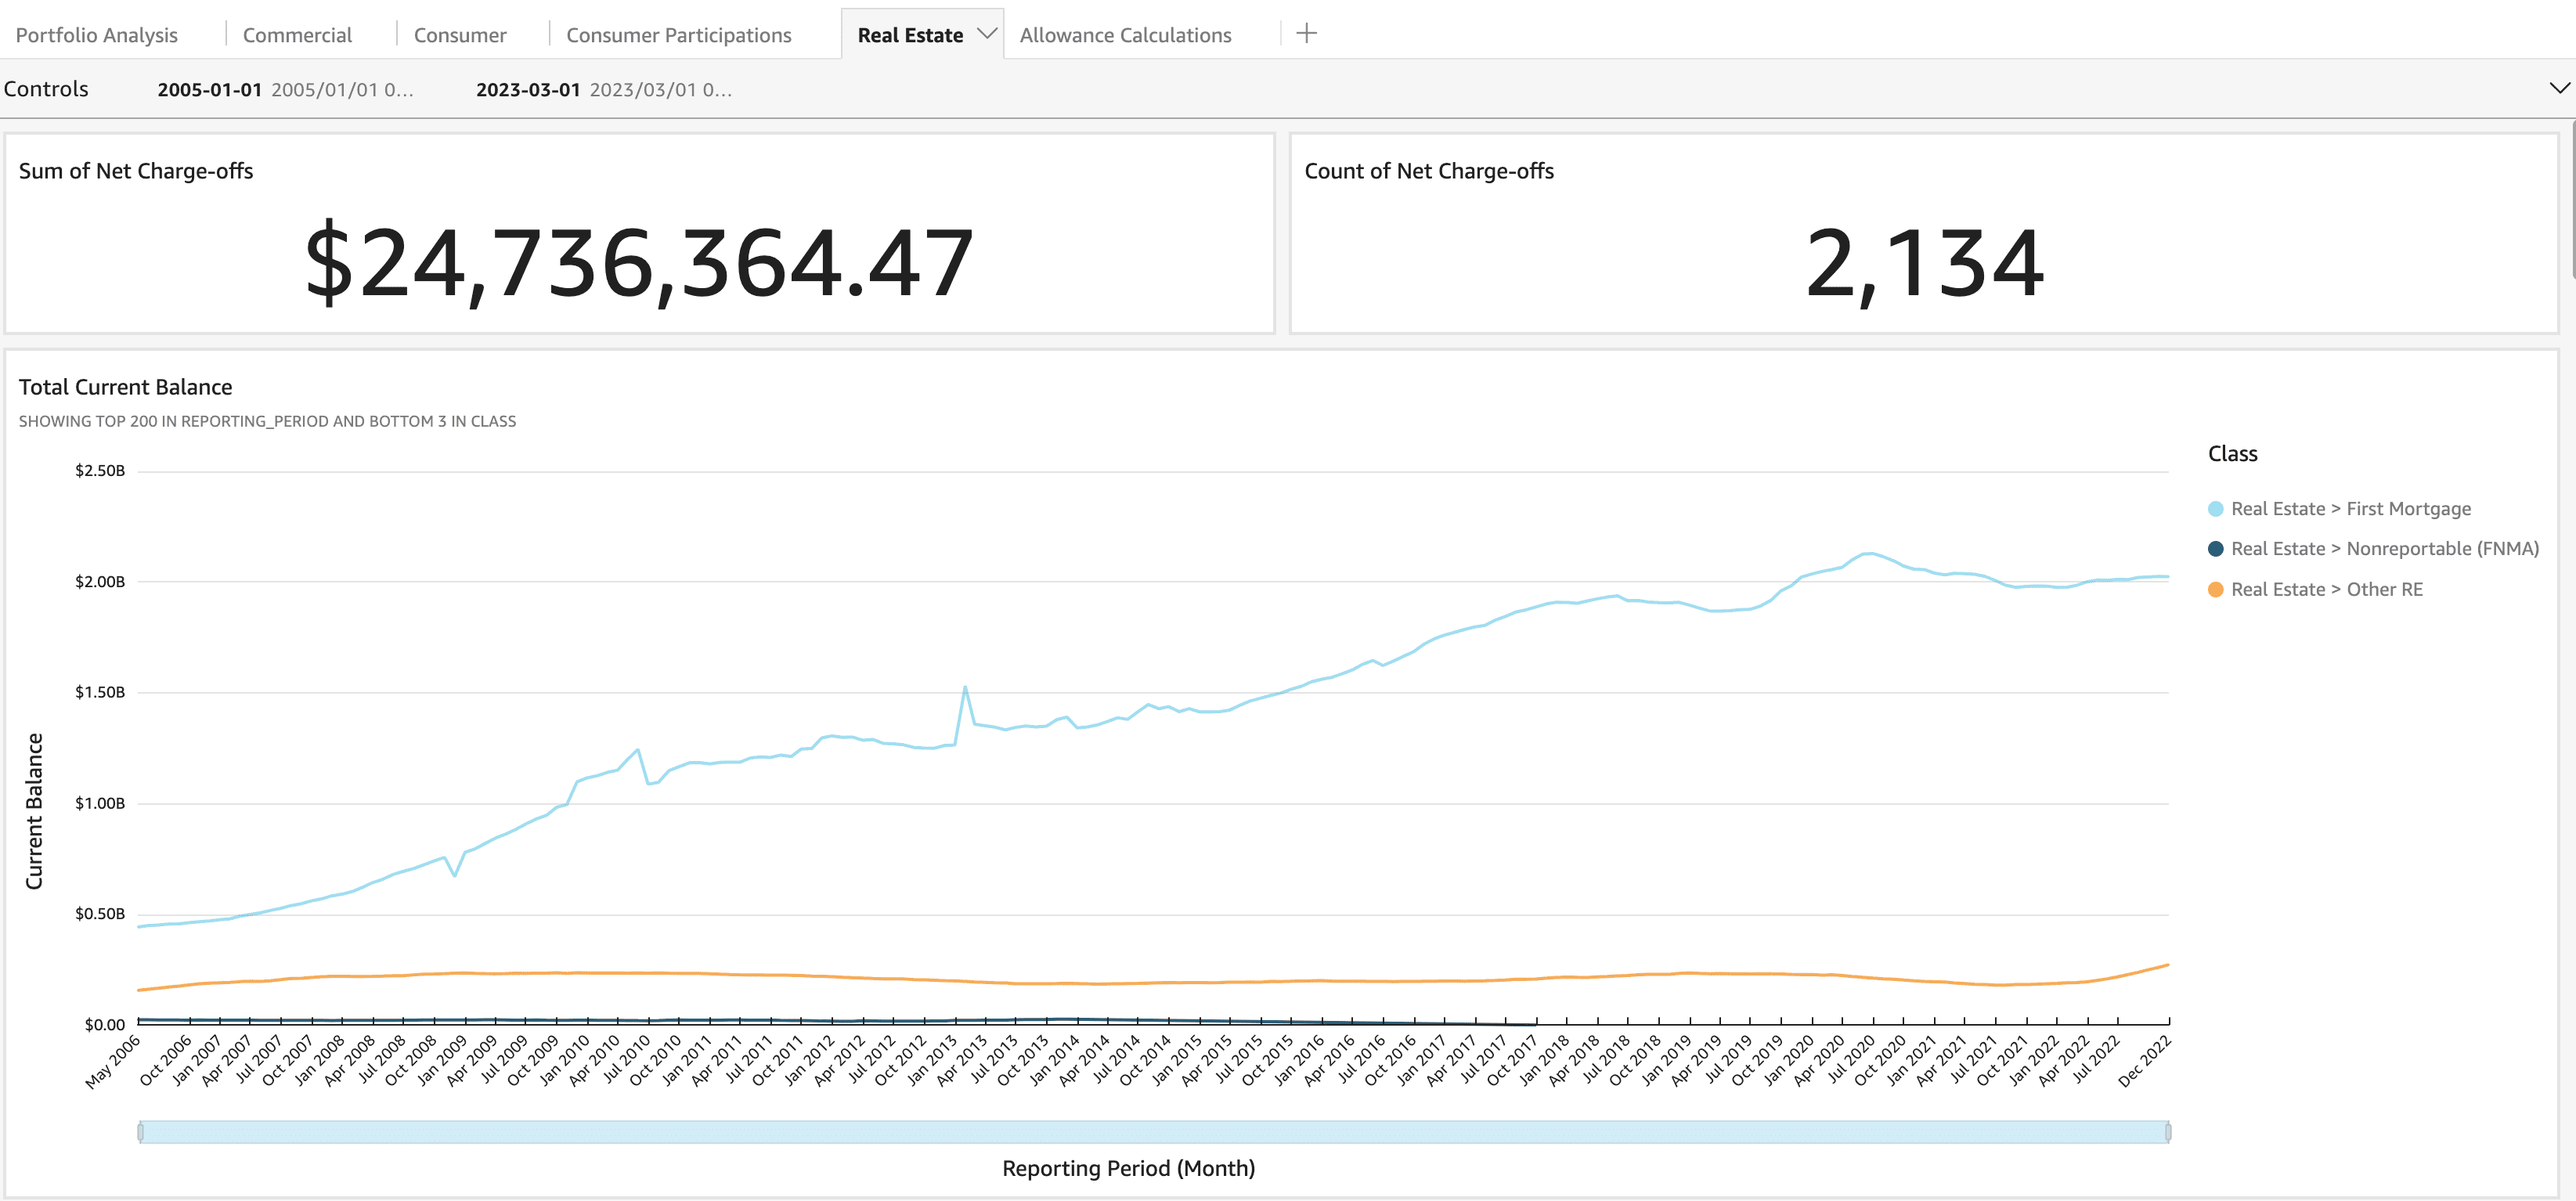
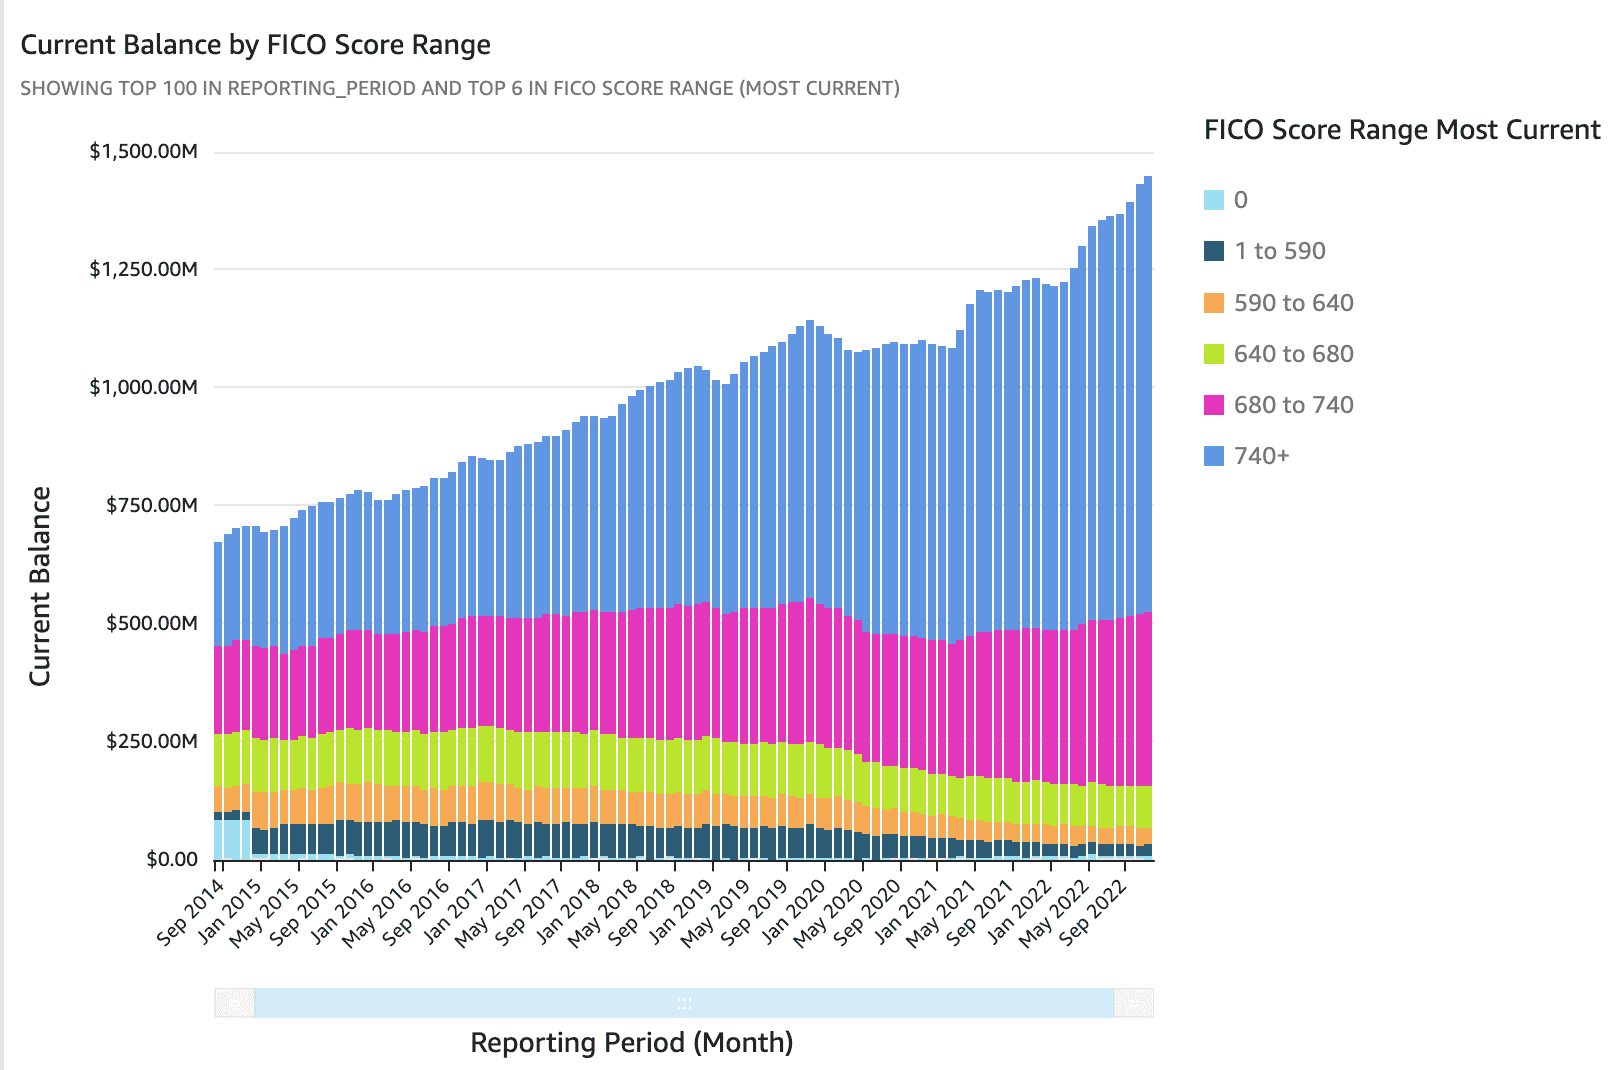
ARCSys Business Intelligence enables ARCSys clients to visualize their portfolios using any data elements loaded, as well as ARCSys’ calculated fields. The visualizations create dynamic tables, charts, and graphs representing data analysis and allowance calculations. These visualizations can be shared with shareholders or colleagues seeking management information on their loan and investment portfolios.

Our standard analytics dashboard provides insights into your historical and current data, extending beyond CECL, to assist with loan pricing and various reporting needs across your institution. The standard visualizations are displayed based on both vintage and reporting period datasets.

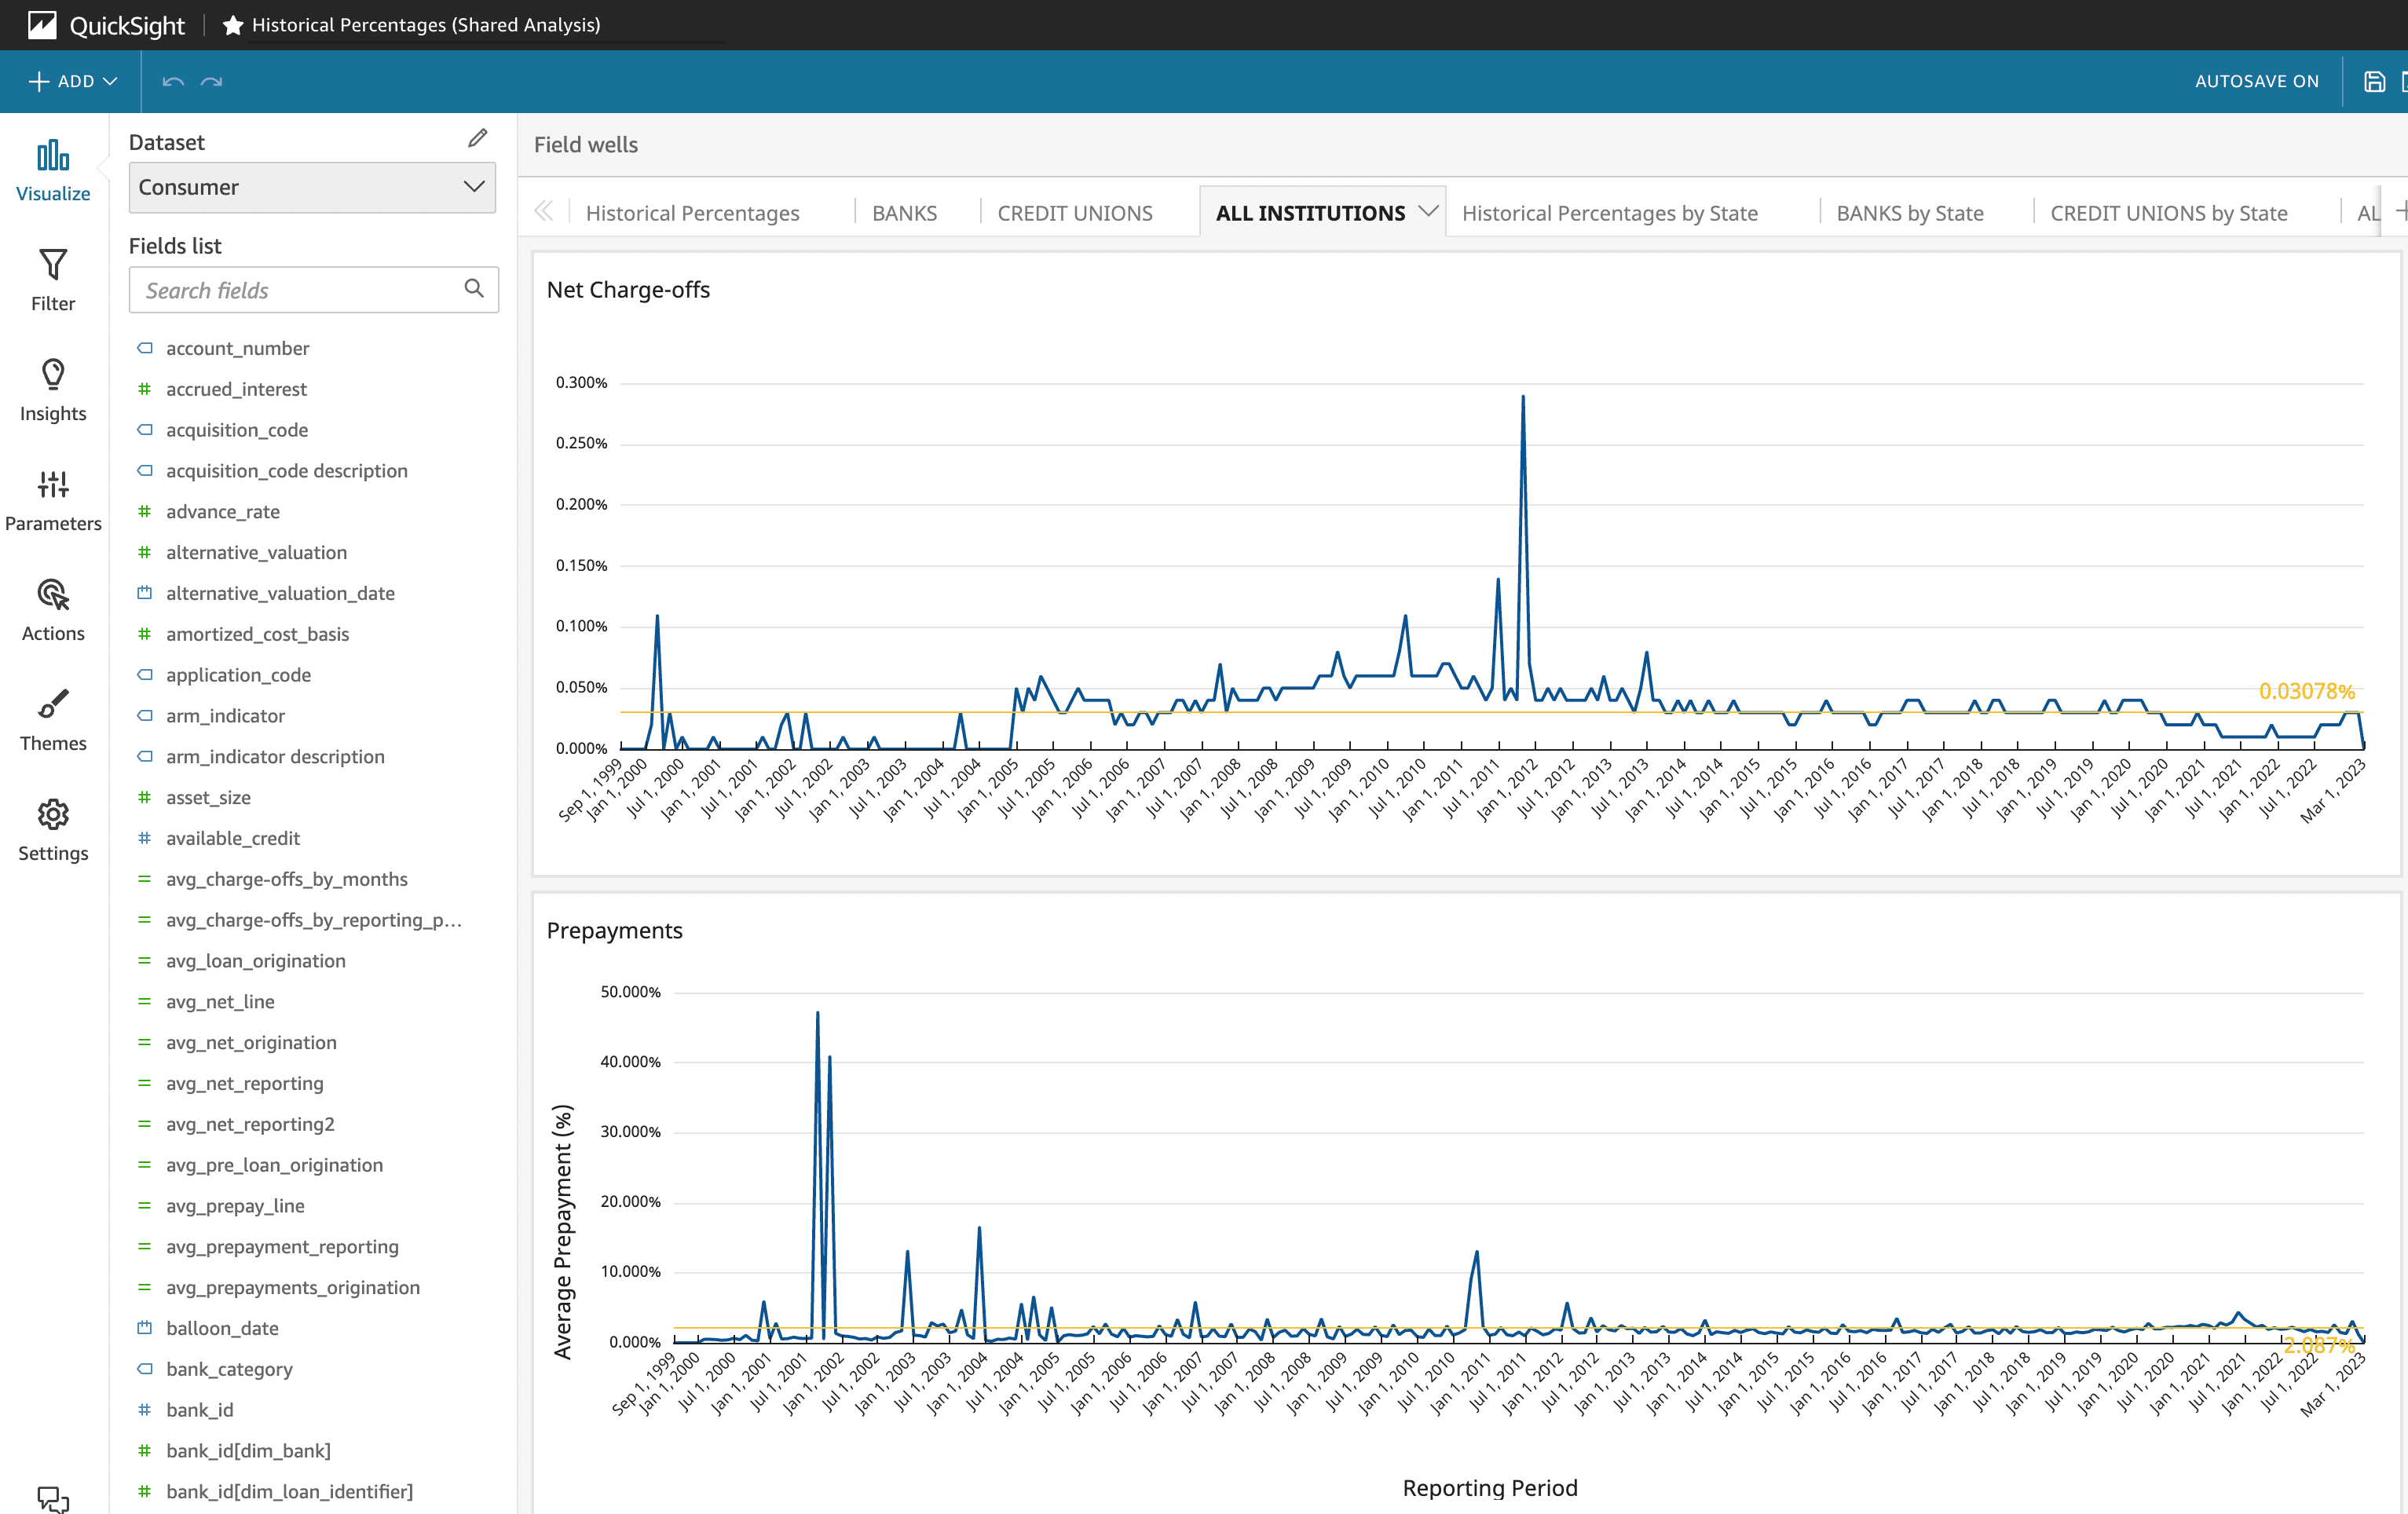
Data points from disparate data sources, such as various core files, spreading software, and credit bureau data, are aggregated into a single repository for dynamic analytics. Institutions can also develop their own customized analytics and visualizations using their data, or using the ARCSys anonymized dataset that supports internally developed KPI measures.

ARCSys provides summarized institutional data from all ARCSys clients for benchmarking against other institutions based on similar asset size, geography, and portfolio composition, as well as supplementing their CECL model if necessary. The dataset contains information pertaining to loan activity, including charge-offs, prepayments, probability of default, and loss given default. In addition, information by credit quality indicator is also available.

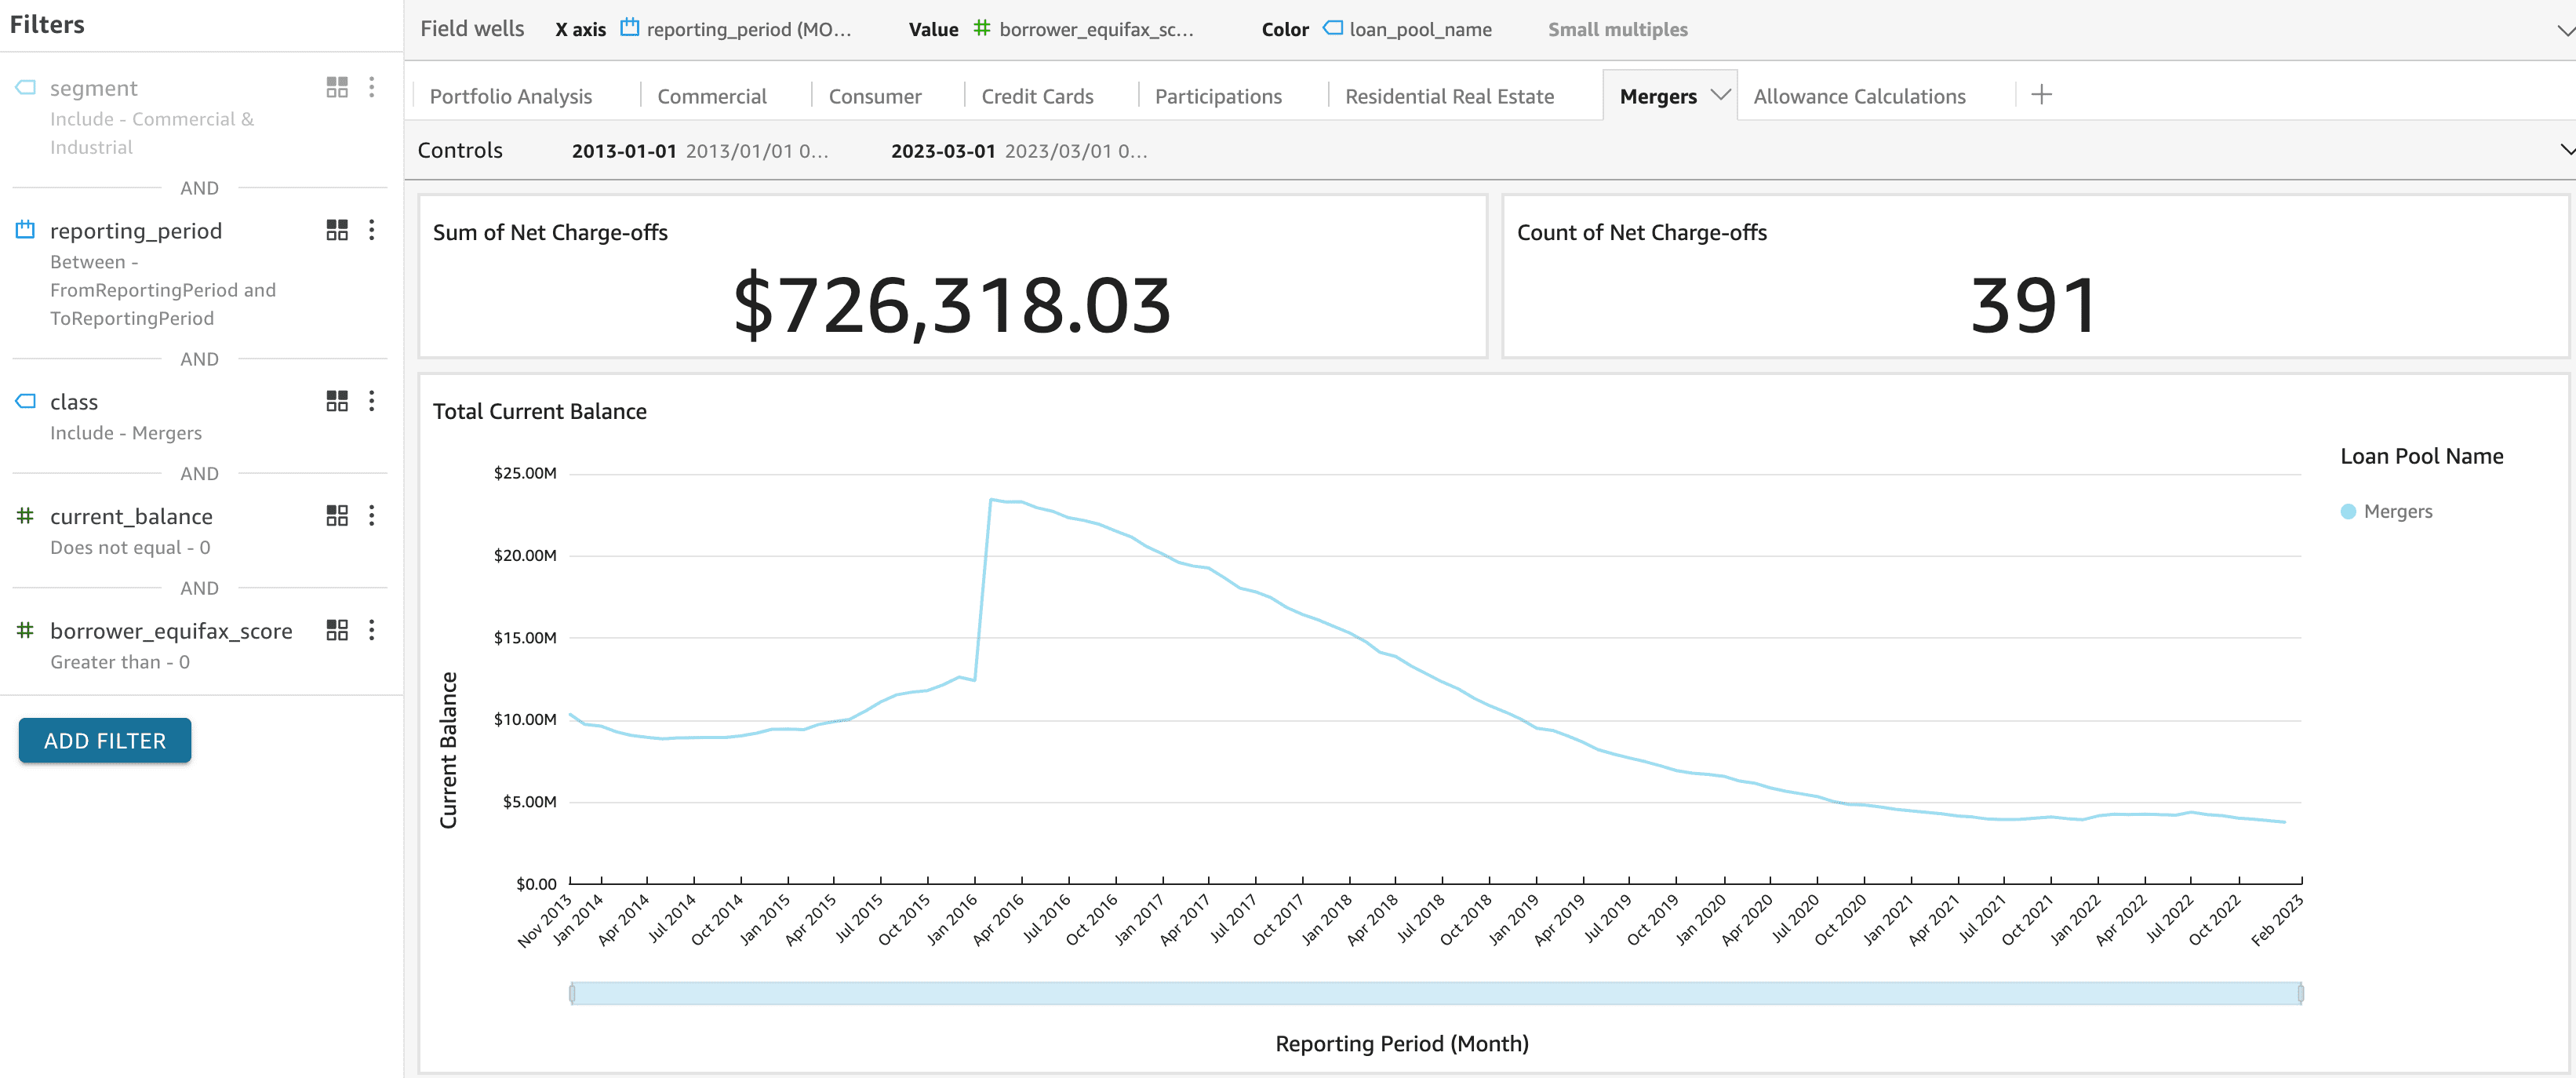
When new data becomes available, such as from a merger, and it is loaded into the ARCSys system, it will be available for analysis immediately.
The best CECL analytics are built with

"The software has made creating board reports a much easier process, not to mention efficient.
The reporting and historical data analysis is also extremely useful for our auditors and
disclosures."

ARCSys Business Intelligence allows you to Create Custom Visualizations using your own data after it is cleaned up, validated, and enriched by the ACL Calculator.
Our Data Science & Statistical Modeling Team is ready to answer questions and provide support.
As we add New Visualizations and fields to ARCSys Business Intelligence, they can be added to your standard analytics.
You can Download Visuals as images or export the underlying data in Excel format.
Your BI Authors can create analyses & shared dashboards.
Your BI Users can view & interact with dashboards created by BI authors or included with ARCSys Business Intelligence.
